“بي واي دي” الصينية تُطلق ثورة في عالم السيارات: محرك جديد بمدى قيادة يتجاوز 2000 كيلومتر
“بي واي دي” الصينية تُطلق ثورة في عالم السيارات: محرك جديد بمدى قيادة يتجاوز 2000 كيلومتر
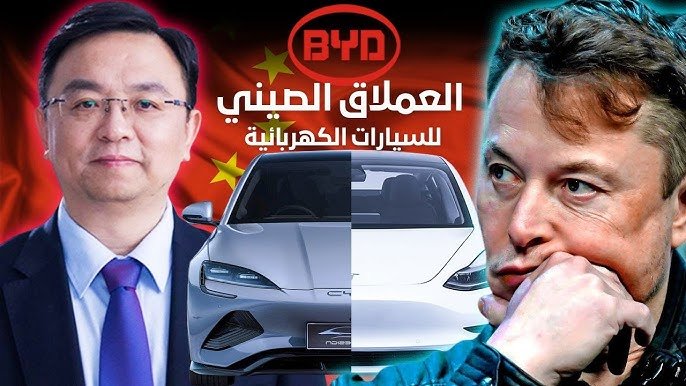
تستعد شركة “بي واي دي” الصينية لإعادة كتابة قواعد لعبة السيارات في العالم، معلنةً عن إطلاق جيل جديد من محركاتها الهجينة في عام 2025، والذي يُعد بإنجاز كان يُعتقد أنه مستحيل: مدى قيادة يتجاوز 2000 كيلومتر بخزان وقود وشحنة كهربائية واحدة. هذا التطور لا يمثل مجرد تحديث تقني، بل هو قفزة نوعية تضع “بي واي دي” في مواجهة مباشرة مع عمالقة الصناعة مثل “تسلا” و”تويوتا”.
من صناعة البطاريات إلى غزو أسواق السيارات
بدأت قصة “بي واي دي” في عام 1995 كشركة متخصصة في صناعة البطاريات القابلة لإعادة الشحن. لم تدخل عالم السيارات إلا في عام 2003، لكن نقطة التحول الحقيقية كانت في عام 2008 مع إطلاق أول سيارة هجينة قابلة للشحن. اليوم، وبعد سنوات من البحث والتطوير، أصبحت “بي واي دي” قوة لا يستهان بها في أسواق السيارات الكهربائية والهجينة.
الجيل الخامس من محركات “DM”: سر الكفاءة الخارقة
يكمن جوهر هذه الثورة في الجيل الخامس من محركات “دي إم” (DM) الهجينة، والذي حقق أرقاماً قياسية مذهلة:


- كفاءة حرارية تاريخية: تصل إلى 46.06%، وهو رقم يتجاوز بكثير متوسط كفاءة المحركات في الصناعة الذي يبلغ حوالي 41%. هذا يعني أن المحرك يستغل نسبة أكبر من طاقة الوقود لتحريك السيارة، ويقلل من الطاقة المهدرة على شكل حرارة.
- استهلاك وقود استثنائي: يبلغ 2.9 لتر فقط لكل 100 كيلومتر، مما يجعله أحد أكثر المحركات اقتصادية في العالم.
وداعاً لقلق المسافة: أكثر من 2000 كيلومتر بلا توقف
الإنجاز الأبرز لهذا المحرك هو قدرته على منح سيارات مثل “كين إل دي إم-آي” (Qin L DM-i) و”سي إل 06 دي إم-آي” (Seal 06 DM-i) مدى قيادة يتجاوز 2000 كيلومتر. هذا الرقم يلغي تماماً “قلق المدى” الذي كان يشكل أكبر عائق أمام انتشار السيارات الكهربائية والهجينة، ويفتح الباب أمام رحلات طويلة دون الحاجة للتوقف المتكرر للتزود بالوقود أو الشحن.
استراتيجية ذكية: جودة عالية بأسعار تنافسية
لا تقتصر قوة “بي واي دي” على التقنية فحسب، بل تمتد إلى استراتيجيتها التسويقية التي ترتكز على تقديم سيارات متطورة بأسعار في متناول الجميع. وخير مثال على ذلك سيارة “سيجول” الكهربائية التي طرحتها بسعر يقل عن 7800 دولار أمريكي، محققةً نجاحاً باهراً وآلاف الطلبات المسبقة.
بطاريات “بليد” والتكامل العمودي: أسرار النجاح
يعود جزء كبير من هذا التفوق إلى سيطرة “بي واي دي” الكاملة على عملية التصنيع، بدءاً من المواد الخام وصولاً إلى المنتج النهائي، وهو ما يُعرف بـ”التكامل العمودي”. هذا يسمح للشركة بتقليل التكاليف وزيادة الجودة. كما أن تطويرها لتقنية بطاريات “بليد” (Blade) المبتكرة، والتي تتميز بأمانها الفائق وكثافة طاقتها العالية وقدرتها على الشحن السريع، كان عاملاً حاسماً في تحقيق هذا المدى القياسي.
تصميم مستقبلي وتجربة قيادة فاخرة
تجمع سيارات “بي واي دي” الجديدة بين الأداء المتفوق والتصميم الجذاب. فبتصاميمها المستوحاة من الثقافة الصينية التقليدية، ومقصوراتها الداخلية الأنيقة المجهزة بشاشات دوارة ومواد عالية الجودة، توفر الشركة تجربة قيادة مريحة وفاخرة تنافس السيارات التقليدية.
في الختام، تثبت “بي واي دي” أنها لا تكتفي بمواكبة التطور في صناعة السيارات، بل تسعى لقيادته. فبفضل محركها الجديد، هي لا تقدم مجرد سيارة هجينة، بل تعيد تعريف مفهوم الكفاءة والمدى، وتبعث برسالة واضحة للمنافسين بأن المستقبل قد وصل، وبسعر في متناول الجميع.