Optimizing Supply Chain Logistics Administration: A Strategic Framework for Enhanced Performance
Optimizing Supply Chain Logistics Administration: A Strategic Framework for Enhanced Performance
Modern supply chain logistics administration has evolved into a sophisticated ecosystem requiring strategic coordination across five critical domains. Companies implementing comprehensive logistics optimization frameworks report up to 49% improvement in operational efficiency and 20-30% enhancement in performance through strategic technology integration and process refinement.
Transportation Management: The Backbone of Efficient Logistics
Transportation management serves as the primary driver of supply chain velocity and cost optimization. Effective transportation strategies can reduce operational costs by 20% while improving delivery performance.
Five Essential Transportation Management KPIs
Route Optimization Efficiency measures the improvement gained through strategic route planning.
Calculation Example:


- Miles Before Optimization: 15,000
- Miles After Optimization: 12,500
- Route Optimization Improvement: 16.7%
- Formula: ((Miles Before – Miles After) / Miles Before) × 100
Carrier Performance Rate tracks on-time delivery reliability across your carrier network.
Calculation Example:
- On-time Deliveries: 285 out of 300 total deliveries
- Carrier Performance Rate: 95.0%
- Formula: (On-time Deliveries / Total Deliveries) × 100
Transportation Cost per Unit provides critical visibility into shipping economics.
Calculation Example:
- Total Transport Cost: $45,000
- Units Shipped: 18,000
- Cost per Unit: $2.50
- Formula: Total Transport Cost / Units Shipped
Load Utilization Rate optimizes capacity management and reduces empty miles.
Calculation Example:
- Actual Weight: 22,000 lbs
- Maximum Capacity: 26,000 lbs
- Load Utilization Rate: 84.6%
- Formula: (Actual Weight / Maximum Capacity) × 100
Freight Damage Rate monitors shipment integrity throughout the transportation process.
Calculation Example:
- Damaged Shipments: 8 out of 500 total shipments
- Freight Damage Rate: 1.60%
- Formula: (Damaged Shipments / Total Shipments) × 100
Advanced transportation management systems enable real-time tracking, route optimization, and carrier performance analysis, facilitating data-driven decision-making that reduces costs while improving service levels.
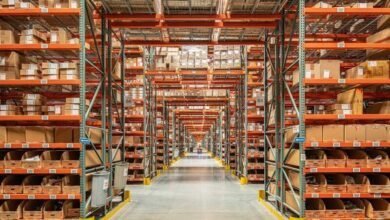
Warehouse & Inventory Management: Optimizing Storage and Flow
Warehouse efficiency directly impacts overall supply chain performance, with top-performing facilities achieving inventory accuracy rates exceeding 99.5%. Strategic warehouse management focuses on maximizing space utilization while maintaining optimal inventory levels.
Five Critical Warehouse & Inventory KPIs
Inventory Turnover Ratio measures how efficiently inventory converts to sales.
Calculation Example:
- Cost of Goods Sold: $2,400,000
- Average Inventory: $400,000
- Inventory Turnover Ratio: 6.0x annually
- Formula: Cost of Goods Sold / Average Inventory
Inventory Accuracy Rate ensures system data aligns with physical inventory counts.
Calculation Example:
- System Count: 9,950 units
- Physical Count: 9,920 units
- Inventory Accuracy Rate: 99.70%
- Formula: (Min Count / Max Count) × 100
Warehouse Space Utilization optimizes facility capacity and reduces carrying costs.
Calculation Example:
- Used Space: 85,000 sq ft
- Total Available Space: 120,000 sq ft
- Space Utilization: 70.8%
- Formula: (Used Space / Total Available Space) × 100
Order Picking Accuracy directly impacts customer satisfaction and operational costs.
Calculation Example:
- Accurate Picks: 4,750 out of 4,800 total picks
- Picking Accuracy: 98.96%
- Formula: (Accurate Picks / Total Picks) × 100
Inventory Carrying Cost quantifies the true cost of holding inventory.
Calculation Example:
- Inventory Value: $800,000
- Carrying Rate: 25%
- Annual Carrying Cost: $200,000
- Formula: Inventory Value × Carrying Rate
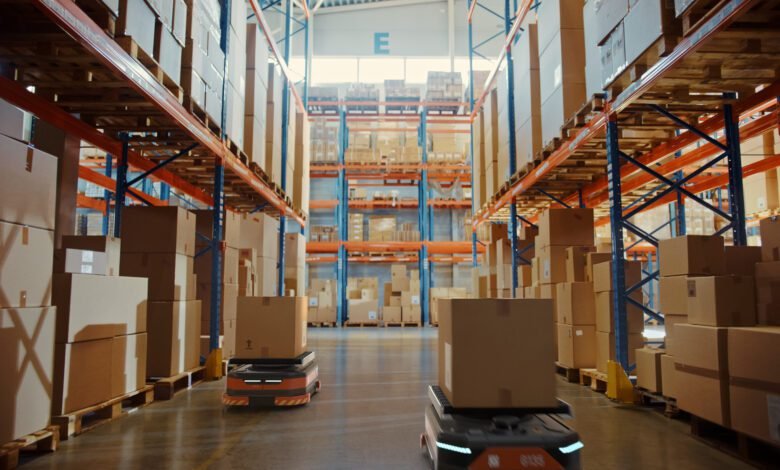
Modern warehouse management systems leverage IoT sensors, automated storage systems, and AI-driven demand forecasting to optimize inventory levels while maintaining high service levels.
Order Fulfillment & Distribution: Delivering Customer Excellence
Order fulfillment excellence requires seamless coordination between inventory management, picking operations, and distribution networks. Companies achieving perfect order rates above 85% demonstrate superior operational control.
Five Key Order Fulfillment & Distribution KPIs
Perfect Order Rate represents the ultimate measure of fulfillment excellence.
Calculation Example:
- Orders On-time: 940/1000 (94.0%)
- Orders Complete: 955/1000 (95.5%)
- Orders Damage-free: 965/1000 (96.5%)
- Orders Accurate Documentation: 970/1000 (97.0%)
- Perfect Order Rate: 84.03%
- Formula: (% On-time × % Complete × % Damage-free × % Accurate) × 100
Order Cycle Time measures the speed of order processing from receipt to delivery.
Calculation Example:
- Order Received: Day 1
- Order Delivered: Day 8
- Order Cycle Time: 7 days
- Formula: Delivery Date – Order Date
Fill Rate indicates inventory availability to meet immediate demand.
Calculation Example:
- Orders Filled Immediately: 850 out of 900 orders
- Fill Rate: 94.4%
- Formula: (Orders Filled Immediately / Total Orders) × 100
Distribution Cost per Order tracks the economics of order fulfillment.
Calculation Example:
- Total Distribution Cost: $75,000
- Orders Processed: 2,500
- Cost per Order: $30.00
- Formula: Total Distribution Cost / Orders Processed
Last-Mile Delivery Success Rate measures final delivery performance.
Calculation Example:
- Successful Deliveries: 1,180 out of 1,200 attempts
- Last-Mile Success Rate: 98.33%
- Formula: (Successful Deliveries / Attempted Deliveries) × 100
Effective distribution networks utilize multi-modal transportation strategies, cross-docking operations, and collaborative planning to optimize delivery performance while controlling costs.
Compliance & Risk Management: Building Resilient Operations
Supply chain resilience requires proactive risk management, with nearly 80% of organizations experiencing disruptions annually. Strategic compliance programs reduce regulatory exposure while maintaining operational continuity.
Five Essential Compliance & Risk Management KPIs
Supplier Compliance Rate monitors adherence to contractual and regulatory requirements.
Calculation Example:
- Compliant Suppliers: 85 out of 95 total suppliers
- Supplier Compliance Rate: 89.5%
- Formula: (Compliant Suppliers / Total Suppliers) × 100
Weighted Risk Assessment Score quantifies overall supply chain risk exposure.
Calculation Example:
- High Risk Suppliers: 8 (Weight: 3)
- Medium Risk Suppliers: 22 (Weight: 2)
- Low Risk Suppliers: 65 (Weight: 1)
- Average Risk Score: 1.40
- Formula: Σ(Risk Level × Weight) / Total Suppliers
Regulatory Compliance Percentage tracks adherence to industry regulations.
Calculation Example:
- Passed Audits: 18 out of 20 total audits
- Regulatory Compliance Rate: 90%
- Formula: (Passed Audits / Total Audits) × 100
Supply Chain Disruption Recovery Time measures resilience and response capability.
Calculation Example:
- Disruption Start: Day 1
- Full Recovery: Day 4
- Recovery Time: 3 days
- Formula: Recovery Date – Disruption Start Date
Business Continuity Plan Effectiveness validates contingency planning success.
Calculation Example:
- Successful Continuity Tests: 7 out of 8 tests
- BCP Effectiveness: 87.5%
- Formula: (Successful Tests / Total Tests) × 100
Comprehensive risk management frameworks incorporate supplier diversification, scenario planning, and real-time monitoring systems to maintain operational stability during disruptions.
Information & Technology Systems: Enabling Digital Transformation
Technology integration serves as the foundation for modern supply chain excellence. Companies leveraging AI, IoT, and blockchain technologies achieve 20-30% operational efficiency improvements through enhanced visibility and automation.
Five Critical Technology System KPIs
System Uptime Percentage ensures continuous operational availability.
Calculation Example:
- Total Annual Hours: 8,760
- Downtime Hours: 6
- System Uptime: 99.932%
- Formula: ((Total Hours – Downtime) / Total Hours) × 100
Data Integration Accuracy validates seamless information flow across systems.
Calculation Example:
- Successfully Integrated Records: 98,500 out of 100,000
- Integration Accuracy: 98.5%
- Formula: (Successful Integrations / Total Records) × 100
Dashboard Response Time Performance measures system responsiveness for decision-making.
Calculation Example:
- Average Response Time: 2.3 seconds
- Target Response Time: 3.0 seconds
- Performance vs Target: +23.3% better than target
- Formula: (Target – Actual) / Target × 100
Automation Implementation Rate tracks digital transformation progress.
Calculation Example:
- Automated Processes: 28 out of 35 total processes
- Automation Rate: 80.0%
- Formula: (Automated Processes / Total Processes) × 100
ERP Integration Success Rate measures system connectivity effectiveness.
Calculation Example:
- Successful Integrations: 15 out of 16 attempts
- ERP Integration Success Rate: 93.8%
- Formula: (Successful Integrations / Total Attempts) × 100
Modern supply chain technology stacks leverage cloud-based platforms, predictive analytics, and IoT sensors to create integrated ecosystems that enhance visibility, automate processes, and enable data-driven decision-making.
Strategic Implementation Framework
Successful supply chain logistics administration requires systematic measurement, continuous improvement, and technology integration. Organizations implementing comprehensive KPI frameworks across all five domains achieve measurable improvements in efficiency, cost reduction, and customer satisfaction.
The strategic framework emphasizes collaborative planning, demand forecasting, and supplier relationship management as foundational elements for sustainable competitive advantage. Companies prioritizing sustainability practices alongside operational excellence position themselves for long-term success in evolving market conditions.
Regular monitoring of these 25 critical KPIs enables proactive management, risk mitigation, and performance optimization across the complete supply chain logistics ecosystem. The integration of advanced technologies with proven operational strategies creates resilient, efficient, and customer-focused supply chain operations that drive sustainable business growth.