9 Essential Supply Chain KPIs to Master in 2025: A Beginner’s Guide

9 Essential Supply Chain KPIs to Master in 2025: A Beginner’s Guide
Of course. Here is a professional, SEO-friendly blog post for beginners explaining the supply chain KPIs from your image, complete with icons, calculation examples, and best practices.
Title: 9 Essential Supply Chain KPIs to Master in 2025: A Beginner’s Guide
Meta Description: New to logistics? Master your supply chain with our guide to 9 essential KPIs. Learn what they are, why they matter, and how to calculate them with simple examples.
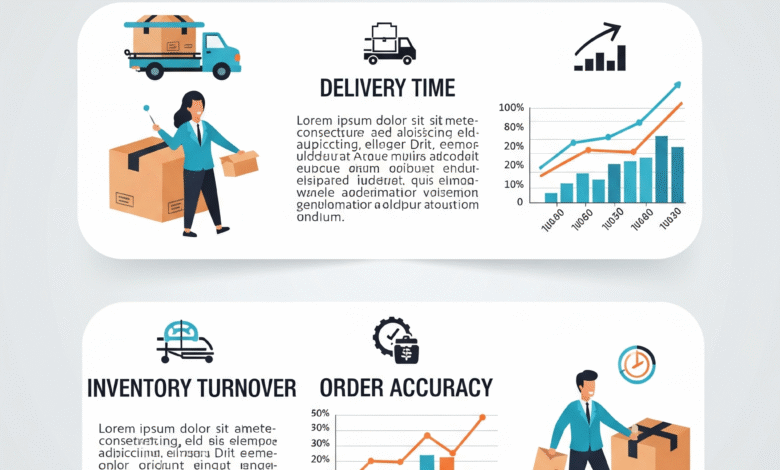
(Image Alt Text Suggestion: An infographic titled “Supply Chain KPIs” showing nine key metrics including Customer Order Cycle Time, Fill Rate, and Inventory Turnover with brief descriptions.)
Introduction: Why You Can’t Manage What You Don’t Measure
In today’s fast-paced global market, an efficient supply chain is the backbone of any successful business. But how do you know if your operations are truly efficient? The answer lies in data, specifically Key Performance Indicators (KPIs).
For beginners, the world of supply chain metrics can seem overwhelming. However, understanding a few essential KPIs can transform your ability to identify problems, make data-driven decisions, and drive significant improvements in cost, speed, and customer satisfaction.
This guide will break down 9 fundamental supply chain KPIs in simple terms, explain why they are critical, and show you exactly how to calculate them.
The 9 Supply Chain KPIs Every Beginner Should Know
1. Customer Order Cycle Time ⏱️
- What it is: The total time it takes from the moment a customer places an order to the moment they receive it.
- Why it matters: This is a direct measure of your supply chain’s responsiveness and is one of the most important metrics for customer satisfaction. A shorter cycle time means happier customers.
- How to calculate it:
- Formula: Actual Delivery Date−Customer Order Date
- Example: A customer places an order on August 10th and receives it on August 15th.
- Customer Order Cycle Time=August 15−August 10=5 days
2. Fill Rate ✅
- What it is: The percentage of a customer’s order that is successfully fulfilled from available stock without backorders or delays.
- Why it matters: A high fill rate indicates excellent inventory management and service levels. It shows how reliably you can meet customer demand from your existing inventory.
- How to calculate it:
- Formula: (Total Items OrderedTotal Items Delivered)×100
- Example: A customer orders 200 items, but due to a stockout, you can only ship 190.
- Fill Rate=(200190)×100=95%
3. Inventory Turnover 🔄
- What it is: This KPI measures how many times your entire inventory is sold and replaced over a specific period (usually a year).
- Why it matters: It highlights demand and inventory health. A high turnover rate is generally good, indicating strong sales. A low rate can signal overstocking, obsolete products, or poor marketing.
- How to calculate it:
- Formula: Average InventoryCost of Goods Sold (COGS)
- Example: Your total COGS for the year is $600,000. Your average inventory value is $100,000.
- Inventory Turnover=$100,000$600,000=6
- This means your inventory turned over 6 times during the year.
4. Cash-to-Cash Cycle Time 💸
- What it is: The number of days between paying for raw materials and receiving the cash from the sale of the finished products.
- Why it matters: This is a crucial financial metric. It assesses your company’s liquidity and the operational efficiency of your entire supply chain. The shorter the cycle, the faster you get your money back and the healthier your cash flow.
- How to calculate it:
- Formula: Days of Inventory Outstanding+Days Sales Outstanding−Days Payables Outstanding
- Example: It takes you 40 days to sell your inventory, 30 days to receive payment from customers, and you pay your own suppliers in 50 days.
- Cash−to−Cash Cycle Time=40+30−50=20 days
5. Order Accuracy 🎯
- What it is: The percentage of orders delivered completely, on time, without damage, and with the correct documentation. This is often called the “Perfect Order Rate.”
- Why it matters: This KPI is a powerful measure of overall operational quality. High accuracy reduces costly returns, boosts customer trust, and lowers customer service overhead.
- How to calculate it:
- Formula: (Total Number of OrdersNumber of Perfect Orders)×100
- Example: In one month, you ship 500 orders, and 485 of them are delivered perfectly.
- Order Accuracy=(500485)×100=97%
6. Freight Cost Per Unit 🚚
- What it is: The average shipping cost to move one unit of product.
- Why it matters: Transportation is a major supply chain expense. Monitoring this KPI helps you control and optimize shipping costs, whether by changing carriers, consolidating shipments, or optimizing routes.
- How to calculate it:
- Formula: Number of Units ShippedTotal Freight Cost
- Example: Your company’s total freight cost for a period was $20,000, and you shipped 8,000 units.
- Freight Cost Per Unit=8,000$20,000=$2.50 per unit
7. Days Sales of Inventory (DSI) 🗓️
- What it is: The average number of days it takes for a company to convert its inventory into sales.
- Why it matters: DSI tells you how long your cash is tied up in inventory. A lower DSI is preferred, as it indicates that inventory is being sold quickly.
- How to calculate it:
- Formula: (Cost of Goods SoldAverage Inventory)×365 days
- Example: Using the same numbers as the Inventory Turnover example ($100,000 average inventory and $600,000 COGS):
- DSI=($600,000$100,000)×365=60.8 days
8. Return Rate ↩️
- What it is: The percentage of shipped goods that are ultimately returned by customers. This is also known as Reverse Logistics.
- Why it matters: A high return rate can signal serious issues with product quality, order accuracy, shipping damage, or mismatched customer expectations. Analyzing returns is key to improving products and processes.
- How to calculate it:
- Formula: (Total Number of Units SoldNumber of Units Returned)×100
- Example: Your company sold 10,000 units in a quarter, and 350 of those were returned.
- Return Rate=(10,000350)×100=3.5%
Conclusion: Start Measuring, Start Improving
Tracking these nine supply chain KPIs is the first step toward building a more resilient, efficient, and customer-focused operation. Start by benchmarking your current performance, then set realistic goals for improvement.
By consistently monitoring these metrics, you can move from reactive problem-solving to proactive, strategic management, ensuring your supply chain becomes a true competitive advantage.
What KPIs are most critical for your business? Share your thoughts in the comments below!


